COVID-19 Data on Vaccinations, Cases and Wastewater


Data will be updated weekdays, except holidays.

Data in this report is preliminary and subject to change. The Anne Arundel County Department of Health receives data from the Maryland Department of Health. We update and share the information we receive for the state. The best source for questions regarding data is the Maryland Department of Health.

Sources: Maryland Department of Health, Maryland COVID-19 Data Dashboard Anne Arundel County Department of Health, Internal Data
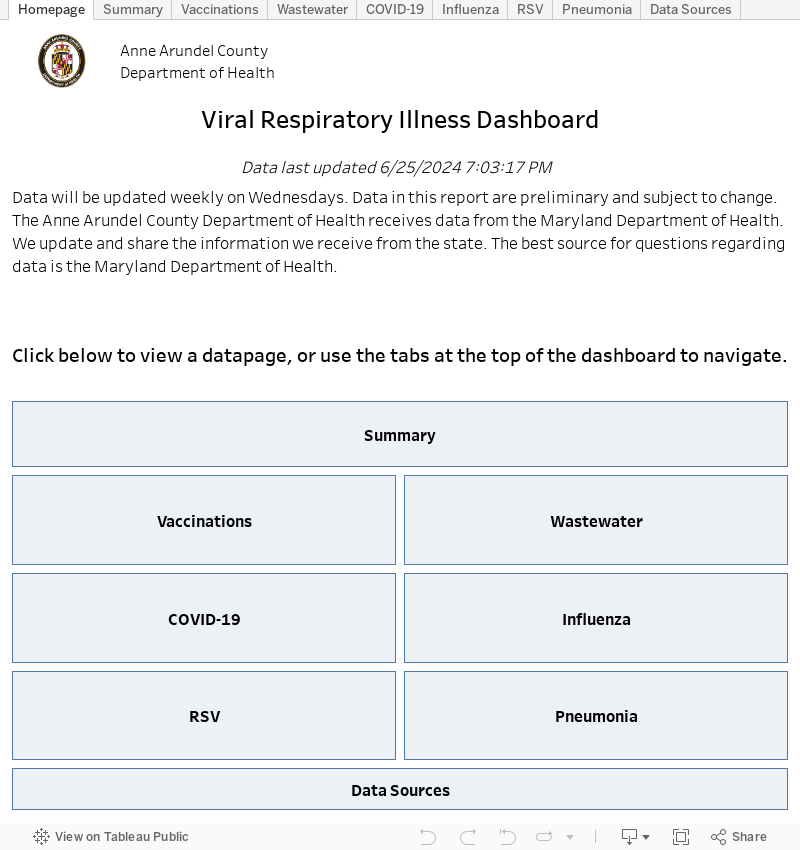

Data will be updated weekly on Wednesdays. Last updated 2/21/24.*

*Updates are temporarily paused due to a change in the wastewater testing vendor.

The Department of Health, in partnership with the County’s Department of Public Works, monitors all seven of the county operated wastewater treatment plants in the county for SARS-CoV-2 (COVID-19). People infected with COVID-19 can shed the virus in their feces. It can be detected in community wastewater, or sewage. Wastewater surveillance measures the presence of SARS-CoV2 in people with and without symptoms.

This is another tool we can use to help monitor COVID-19 spread in Anne Arundel County. Wastewater surveillance does not depend on people having access to healthcare, people seeking healthcare when sick, or the availability of COVID-19 testing. Monitoring wastewater can provide an early indicator of spread of COVID-19 in communities.

Wastewater samples are collected twice a week from the treatment plants in the county, which are sent to the CDC for testing as part of their National Wastewater Surveillance System (NWSS)

To monitor our local data, the most recent three data points for each treatment plant in the county are averaged and categorized based on the following:

Category* Low Detection Medium Detection High Detection
Range of SARS-CoV-2 virus concentration in wastewater
(3 most recent data points average of copies per liter of sewage)
<1,500,000 1,500,000 to 2,999,999 >=3,000,000

*Data Methodology is preliminary; updates may occur as we continue to evaluate local data

COVID-19 Wastewater Results

SARS-CoV-2 Concentration Level from Collected Samples

Sewer service areas

Annapolis

Low Detection

Broadneck

Low Detection

Broadwater

Low Detection

Cox Creek

Low Detection

Maryland City

Low Detection

Patuxent

Low Detection

Piney Orchard

High Detection


Data is updated weekly on Fridays. Vaccination figures have been updated to represent the 2021 Census population estimates.

This data includes all Anne Arundel County residents who have received a COVID-19 vaccine.

"First dose" represents those who have received one dose of either the Pfizer or Moderna COVID-19 vaccines. "Second/single dose" represents those who have received both doses of either the Pfizer or Moderna COVID-19 vaccine or a single dose of the Johnson and Johnson COVID-19 vaccine. "Booster dose" represents those who have received booster doses of the Pfizer or Moderna COVID-19 vaccine, and is calculated as a percentage of the population who completed the initial series.

Data Source: CDC COVID-19 Vaccination Data, Anne Arundel County ImmuNet

Data is updated weekly on Tuesdays

The color scale on the map below symbolizes the average daily case rate over the last 7 days among residents of the ZIP codes. Click on the ZIP code of interest to see the number of new cases among ZIP code residents in the past 7 days, the average daily case rate per 100,000 residents over the past 7 days, and the total number of cases among residents.

This map does not include cases in congregate living settings, Naval Academy (21402) cases, and Fort Meade (20755) cases.

Source: Maryland Department of Health, Maryland COVID-19 Data Dashboard

The COVID-19 Hospital Admission Level measures the impact COVID-19 is having on health and healthcare systems. A risk level can be low, medium, or high. COVID-19 Hospital Admission Levels are determined Friday morning for each county in the United States. Learn more.